By Ray Domanico
Senior fellow and director of education policy, Manhattan Institute
New York State’s system of public elementary and secondary schools is in steep decline, but it is salvageable. The roots of its problems pre-date the onset of the coronavirus pandemic in early 2020, but the system’s response to that challenge accelerated discontent with the schools and harmed students. The damage of those years will not be undone if the state blindly continues to throw money at schools — unless there is a fundamental re-thinking of the purpose and governance of public education.
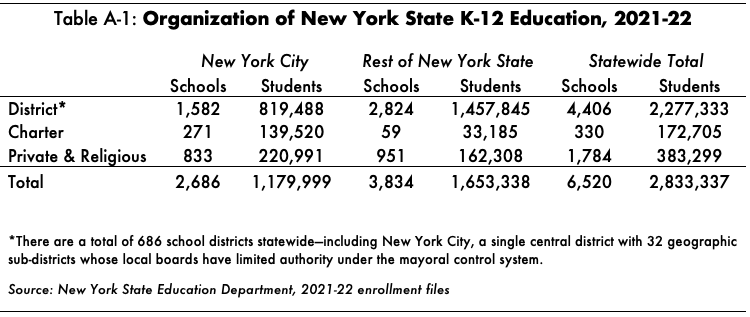
New York consistently leads the nation in K-12 school spending, yet by 50-state standards, student outcomes are mired in the middle. An $11 billion (55 percent) increase in annual state education aid over the last 10 years has failed to move the needle on student achievement. Meanwhile, during the same period, enrollment in the state’s public-school districts has decreased by over 300,000 students, or 11.7 percent. (See Organization of Education in New York State below.)
If higher spending automatically led to higher quality, New York would be a model for the nation. Unfortunately, this model has demonstrably failed, and it is time for state leaders to fundamentally rethink their approach to education.
THE STATUS QUO
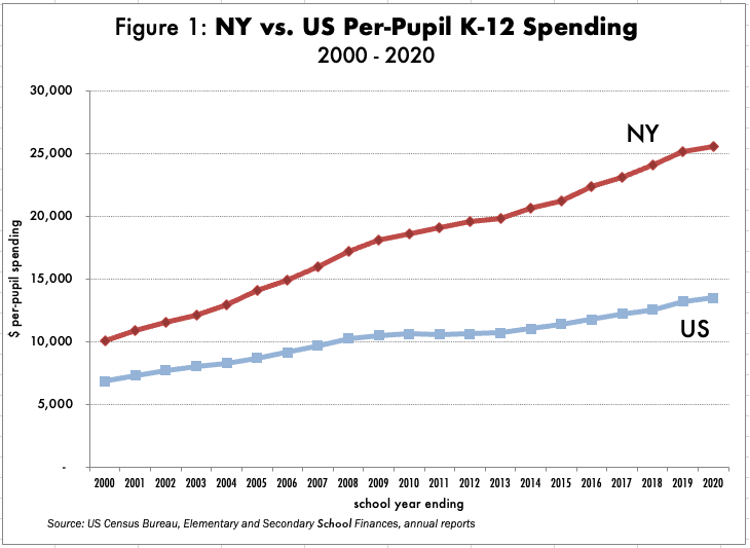
According to the latest U.S. Census data, New York’s K-12 public school spending for 2019-20 came to $25,519 per pupil—89 percent more than the 50-state (plus D.C.) average of $13,494. New York State also continues to considerably outspend neighboring northeastern states: 23 percent more than New Jersey, 20 percent more than Connecticut and 36 percent more than Massachusetts. As reported by the Empire Center, even New York’s poorest, least well-funded districts spend more per pupil than the national average.1Ken Girardin, “NY’s stratospheric school spending,” Empire Center report, July 26, 2017. https://www.empirecenter.org/publications/nys-stratospheric-school-spending/
The education spending gap between New York and the national average has roughly doubled over the past 20 years, as illustrated by Figure 1 below. Noteworthy school spending benchmarks from the annual census data include:
- New York’s spending on instructional salaries and benefits (commonly considered “money in the classroom”) was $17,813 per pupil—more than double the national average of $8,176 and exceeding the totalper-pupil school spending in all but six other states and the District of Columbia.
- In the category of “support services,” which measures the bureaucratic overhead of central district and school building administration, New York ranked sixth with spending of $7,213 per pupil. That was 50 percent above the national average—unsurprising, given New York’s relatively large number of (roughly 700) independently administered local districts. However, if New York had spent the national average in the support category, it stillwould have ranked first in overall per-pupil spending among states.
- New York City’s spending of $28,828 per pupil was by far the highest among the nation’s 100 largest school systems.
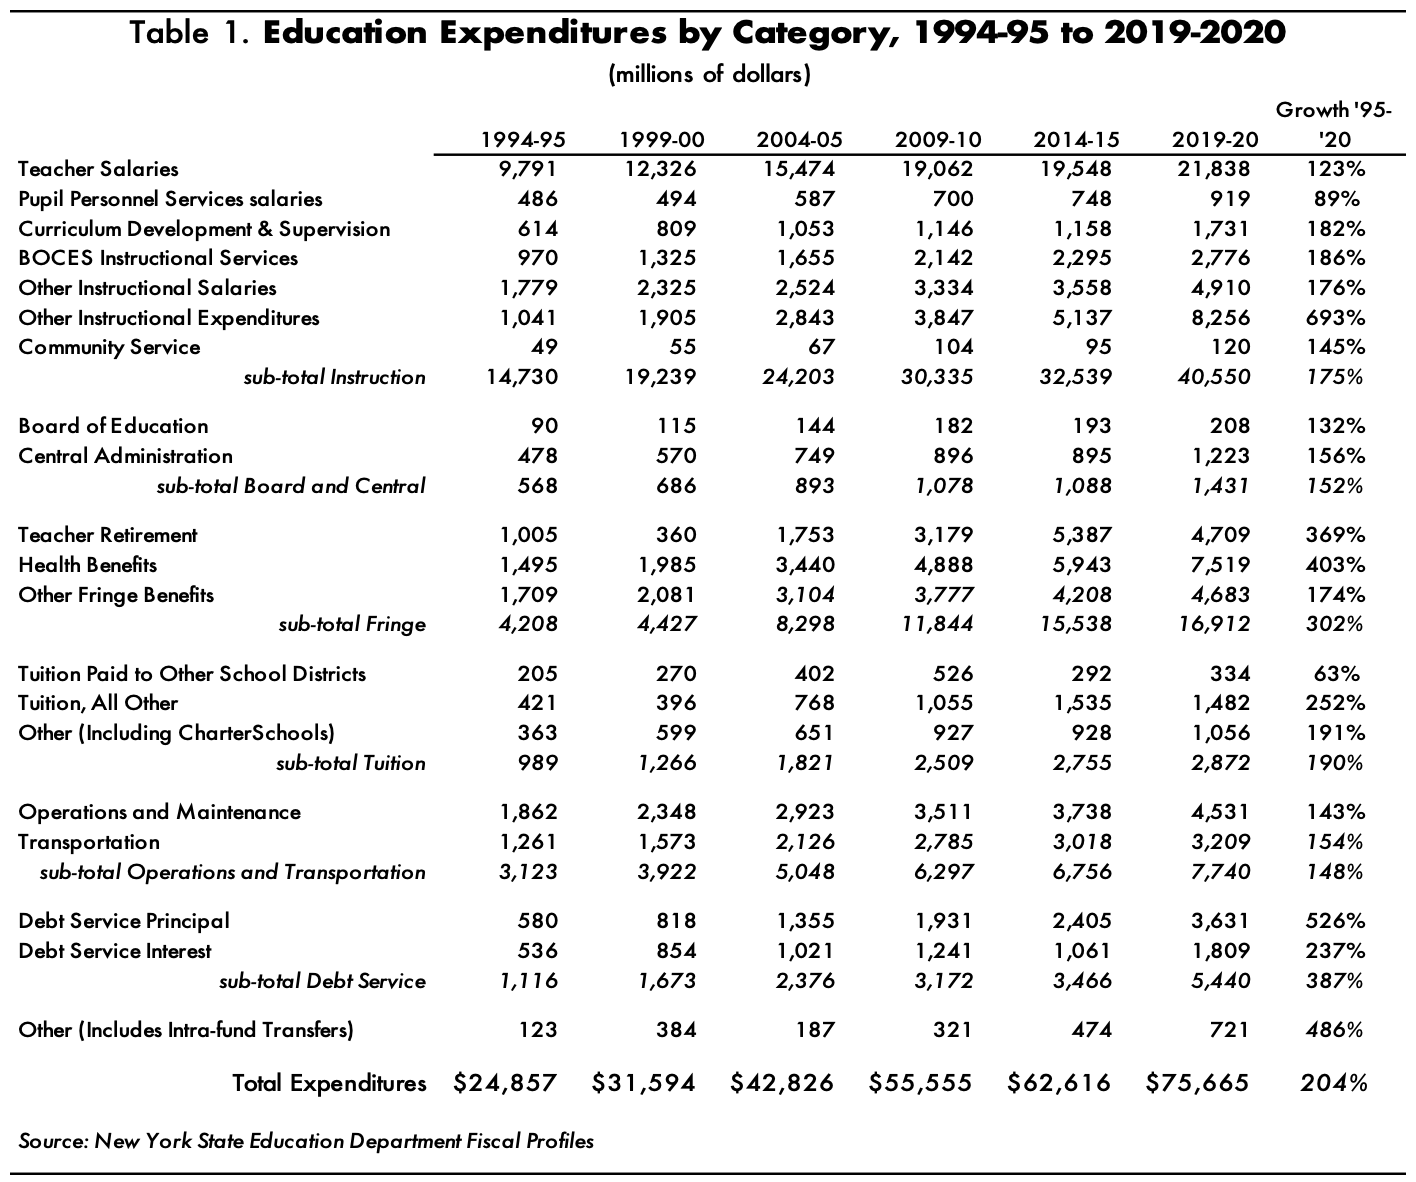
Based on the state Education Department’s own detailed database, which measures spending by somewhat different standards than the Census Bureau, a categorical breakdown of school finance trends over the past 20 years is presented in Table 1. Key trends emerging from state data for 1994-95 to 2019-20:
- Total public-school expenditures across the period more than tripled, from just under $25 billion to more than $75 billion.
- Fringe benefits, including teacher pension fund contributions and health insurance, were the fastest rising component of compensation—more than quadrupling from $4.2 billion to nearly $17 billion, while salaries rose at a still-healthy pace of 175 percent.
- Debt service also increased significantly, reflecting extensive state-subsidized capital investment in new and renovated school buildings.
All of the data, whether state or federal, point to the same conclusion: as outcome measures confirm, New Yorkers are not getting educational results commensurate with their significantly higher spending on schools.
Steps forward and backward
Elementary and secondary education policy trends in New York over the past quarter-century have mixed effective, forward-looking reforms with some degradation of standards in the established system. On the reform side of the ledger, the outstanding educational policy achievement was the 1998 law2Article 56 of state Education Law. making New York the 34th state to expand its definition of “public schools” to include independently operated charter schools. The opening section of the charter school law set forth its purposes in clear, compelling terms:
- Improve student learning and achievement;
- Increase learning opportunities for all students, with special emphasis on expanded learning experiences for students who are at-risk of academic failure;
- Encourage the use of different and innovative teaching methods;
- Create new professional opportunities for teachers, school administrators and other school personnel;
- Provide parents and students with expanded choices in the types of educational opportunities that are available within the public school system; and
- Provide schools with a method to change from rule-based to performance-based accountability systems by holding the schools established under this article accountable for meeting measurable student achievement results.3Ibid.
Simply adapting the law to New York’s established educational governance structure in 1998 would have left the issuance and regulation of charters to the Board of Regents (which is selected entirely by the Legislature) and to local school boards, which would have had strong political and financial incentives to minimize the competition. Crucially, however, the law’s designated charter-authorizing entities also included the State University of New York (SUNY), which is controlled by appointees of the governor—who, from 1998 through 2006, was the chief proponent of charter schools, George Pataki.
As of August 2022, according to data posted with the state Education Department ‘s Charter School Directory,4http://www.nysed.gov/charter-schools/charter-schools-directory there were 360 charter schools serving more than 150,000 students in New York State, the majority (287, serving 142,500 students) in New York City, and the rest mainly in other large cities and older inner suburbs. More than 60 percent of charter schools were authorized by SUNY. Charter schools are financed through the state’s funding formula, which sets charter tuition by dividing district’s Approved Operating Expenditures by Total Allowable Pupil Units. By any standard, charters spend less per-pupil than standard public schools.
As detailed below, charter schools have produced better outcomes than traditional public schools. Parental demand for more charters has remained high, especially in New York City, where charter enrollment expanded during the pandemic even as enrollment in the main public system was declining. As of 2020-21, the waiting list for charter school seats in New York City was estimated at 50,000. However, the total number of charters in the city has reached its maximum limit allowable by state law. Proposals to raise the cap have been strongly opposed by the United Federation of Teachers (UFT) and allied groups, which
have backed proposed legislation that would make the Board of Regents the sole charter authorizer.
Mayoral control
A few years after passage of the charter school law, another major positive education reform came in New York City. Through 2001, the city’s vast centralized school system—by far the largest in the country—had been run by an independently elected Board of Education, which appointed the system’s chancellor. In 2002, the state Legislature changed the law to shift control of the system to the city’s mayor—then Michael Bloomberg, who had made the change one of his top priorities upon taking office that year.
The results were dramatic. Achievement on state tests improved in the city from 2002 through 2019, the last pre-COVID year of testing, pushing the city’s levels above the state average for the first time in memory.
The city’s high-school graduation rate, which had been stuck at 50 percent since the early 1980s, rose dramatically during Mayor Michael Bloomberg’s tenure (2002-13) years and kept rising under Mayor Bill de Blasio, reaching 77 percent by 2019.
For the first 12 years of mayoral control, Mayor Bloomberg and his schools chancellors, Joel Klein and Dennis Walcott, engineered a complete overhaul of the city’s public high schools. They streamlined the central bureaucracy, largely eliminated the power of the many corrupt local school boards and ushered in a well-functioning system based on local control, innovation and accountability. Those changes would have been impossible under the old Board of Education, where powerful interest groups controlled the purse, and parents and students had no voice.
Bloomberg’s team took the extraordinary step of closing many schools for low performance, replacing them with both teacher/community-designed district schools and public charter schools. Overall, Bloomberg’s team did much to increase the supply of good schools in all communities in the city, offering city parents extensive choice within the district and charter school sectors.
The high-water mark of choice-focused education reform efforts in New York came in 2014, when then-Governor Cuomo initially endorsed and promised to push for passage of a bill establishing state tax credits for contributions to private school scholarship funds, as well as “public education entities.”5The Education Investment Incentives Act, S. 6808 of 2013-14. Over a three-year phase-in period, the credits would have totaled $300 million annually and were projected to incentivize another $333 million in contributions to eligible education and scholarship funds. Those were and are exceedingly modest amounts by New York public education standards, but potentially represented enough funding to significantly boost the ability of non-public schools to offer educational choice to families of modest means.
Despite including public school support funds among eligible recipients, the tax credit proposal was strongly opposed by teachers’ unions and allied interest groups. When then-Assembly Speaker Sheldon Silver threatened to hold up a FY 2015 budget deal rather than pass the tax credits, Governor Cuomo backed away from his support for the proposal, which has gone nowhere since.
Retrograde reset for New York City
Twenty years after the historic shift to mayoral control of the New York City schools, the Legislature moved to undermine that reform in two crucial respects. In Spring 2022, the State Legislature unwisely chose to tinker with Mayoral Control of New York City’s schools, despite the success that had occurred in the system since 2002.
Faced with some constituents wary of mayoral control, lawmakers have created a mishmash that will bring only paralysis to a system that badly needs strong leadership. Fortunately, their destructive changes were delayed by a year, giving the Governor and Legislature time to reconsider and rescind or amend the changes. If the legislative program goes forward, Mayor Adams and Chancellor Banks will have to deal with a 23-member Panel for Educational Policy, even as they keep their eyes on the Legislature itself, from which they will need to secure an extension of mayoral control by 2024.
Moreover, the Legislature places an elected official, the city comptroller, on the panel as a nonvoting member. The comptroller has a large staff and incumbent Brad Lander may be inclined to organize opposition to mayoral initiatives. Yet Adams was elected by the people to control the school system; Lander wasn’t.
Finally, the Legislature recently mandated lower class sizes in New York City over the next five years. If this policy is enforced, it will prove incredibly expensive and needlessly hamstring school administration when flexibility is crucial, particularly at a time when the city is losing enrollment across the board and dramatically in some individual schools.
Assessing educational outcomes
As the reform momentum of the 1990s and 2000s faded in New York, decline has more commonly been the theme of major trends in the state’s traditional public school system. While the state has been leading the nation in spending, overall achievement levels New York students have remained mired at the national average for the past 20 years. This is true for the state’s students as a whole and for those from lower-income families, whose needs are often used as the rationale for greater spending.
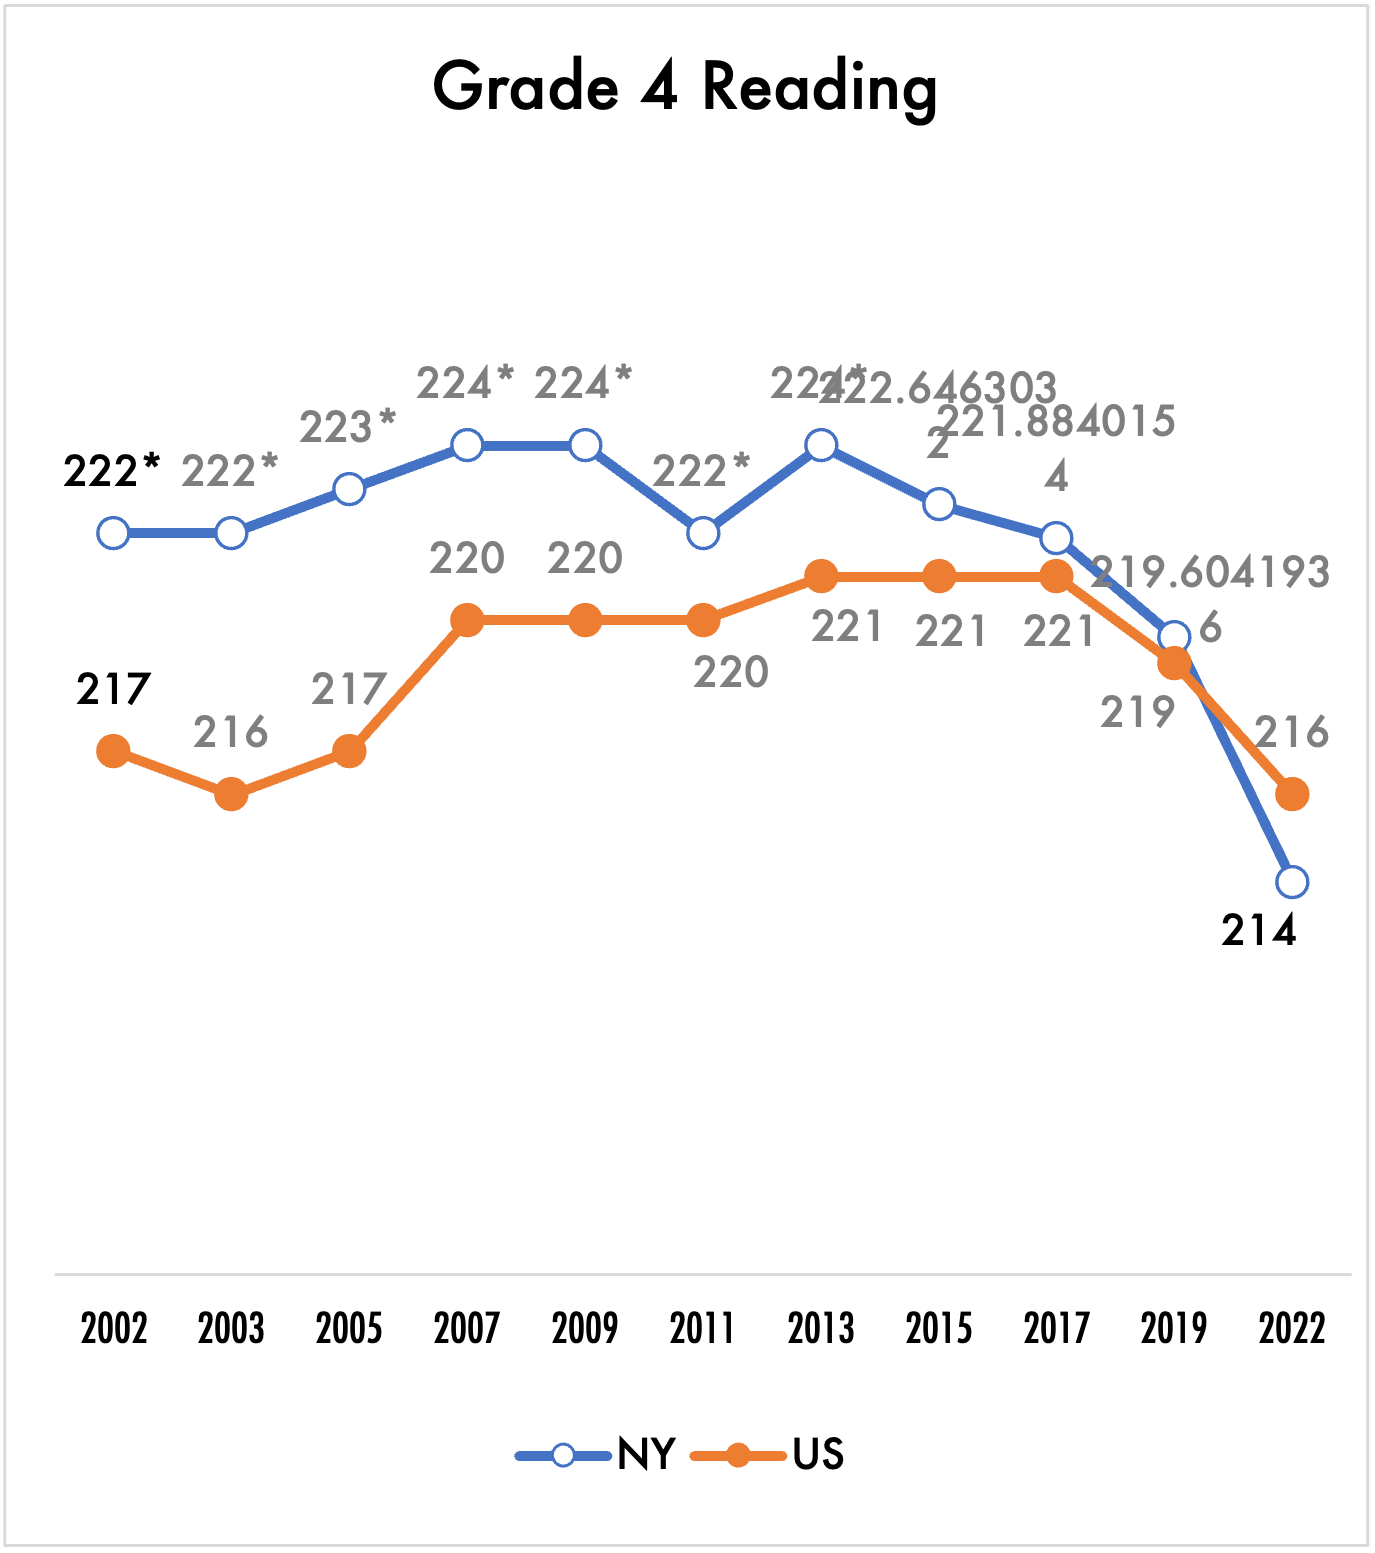
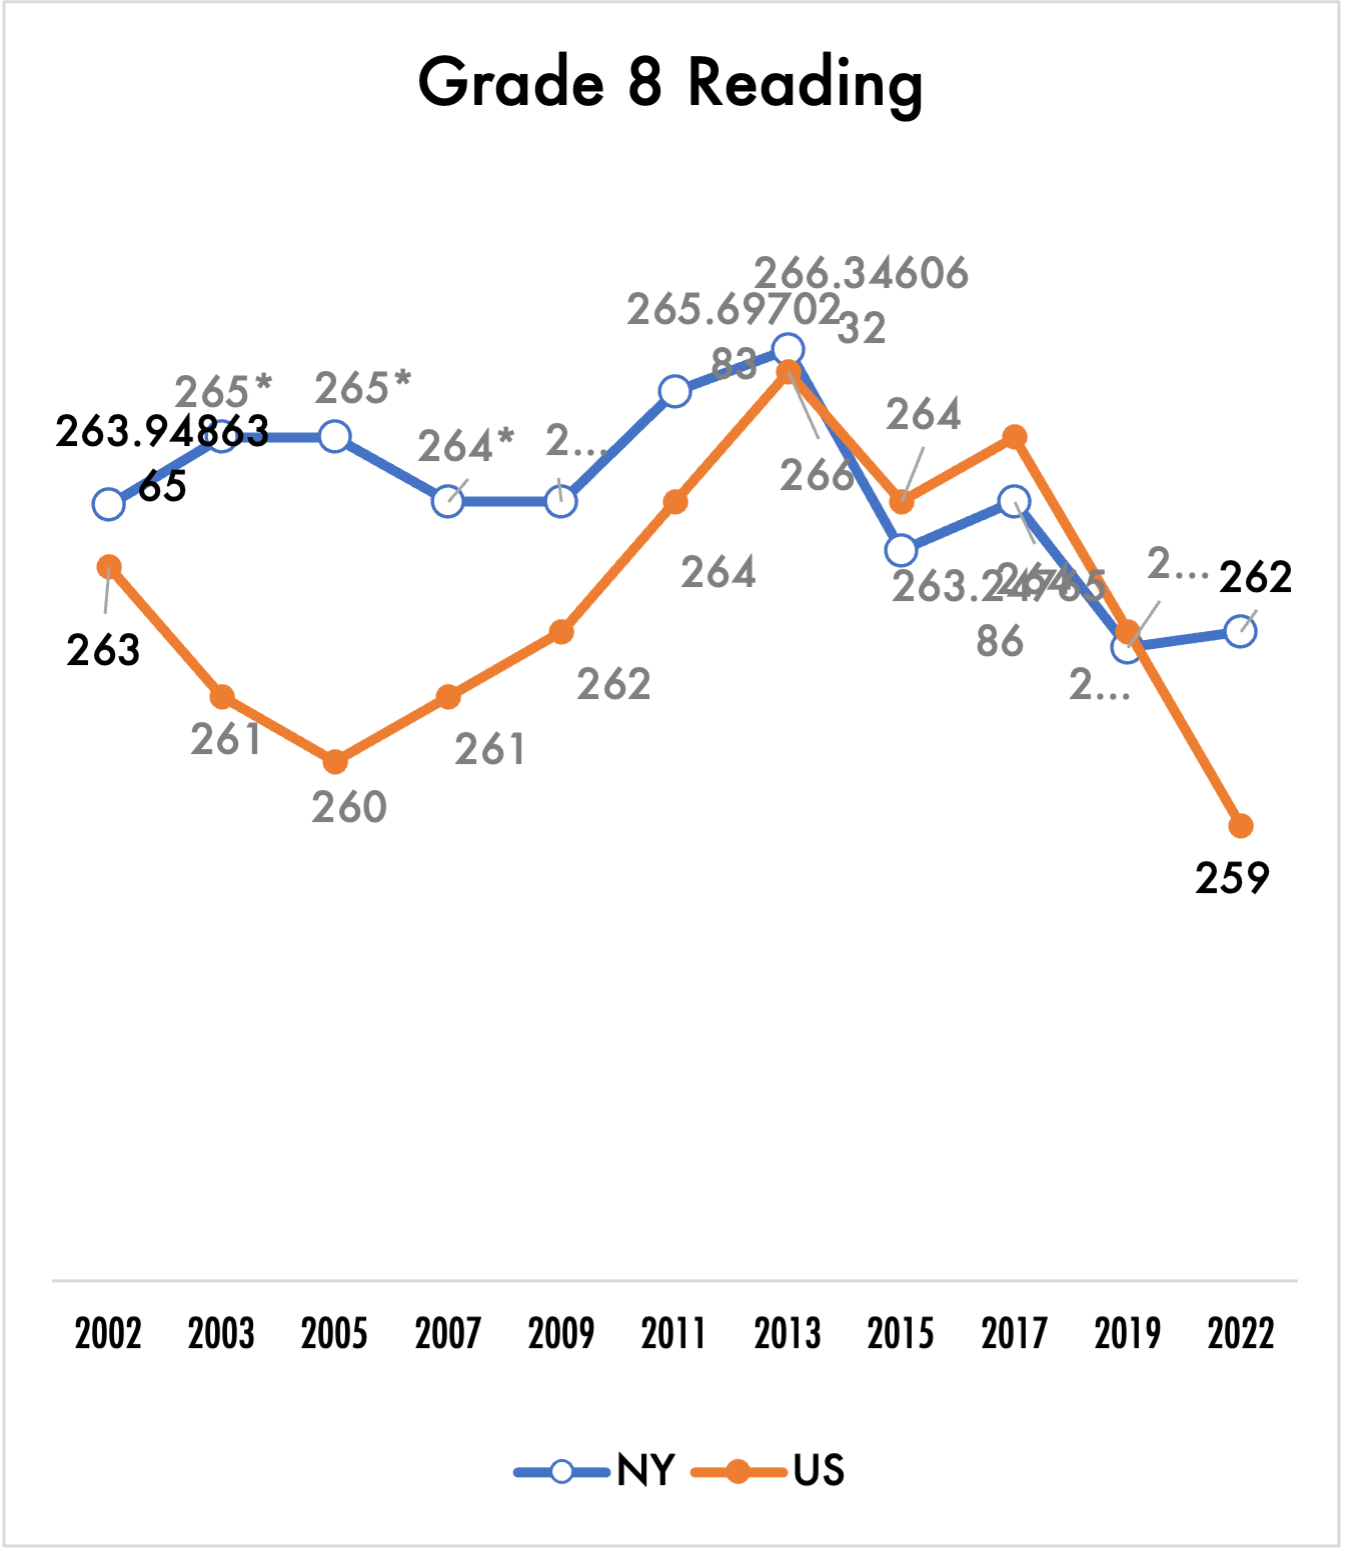
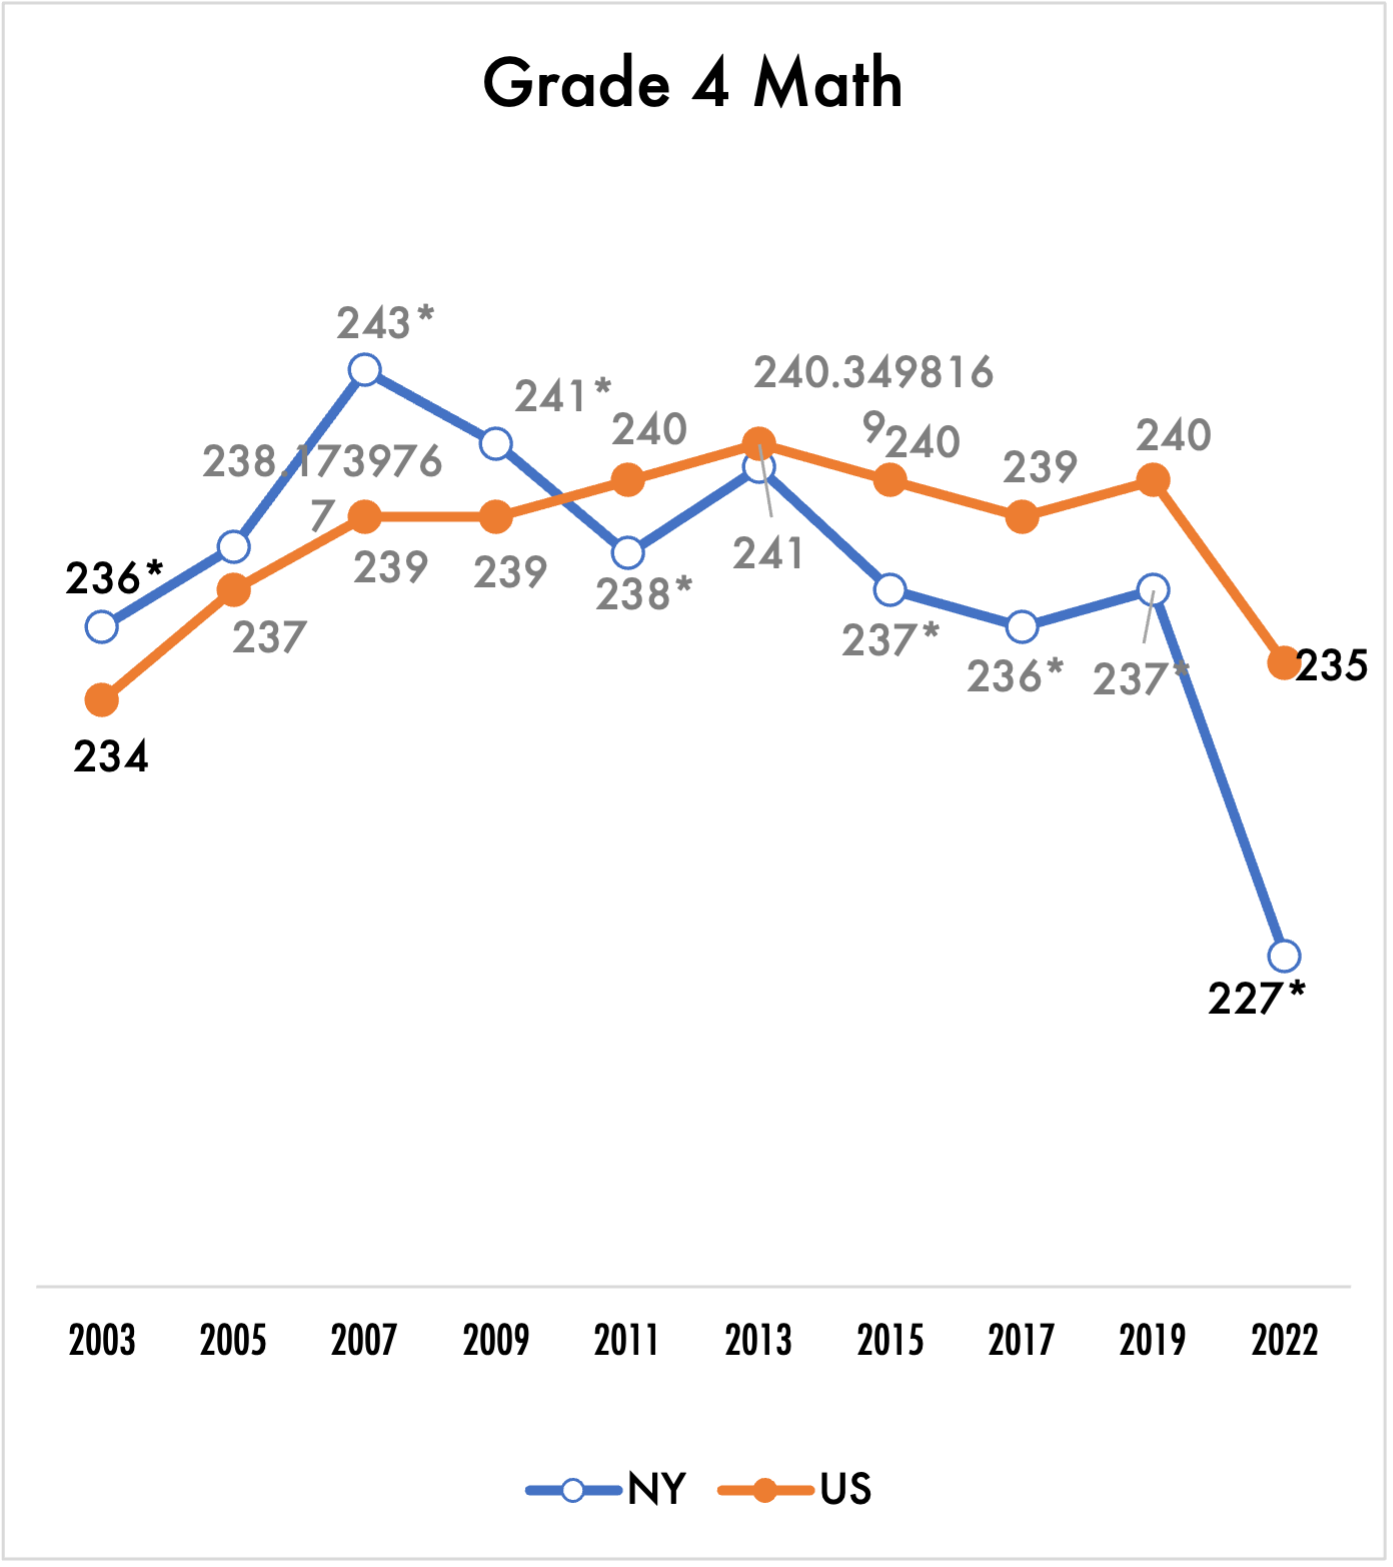
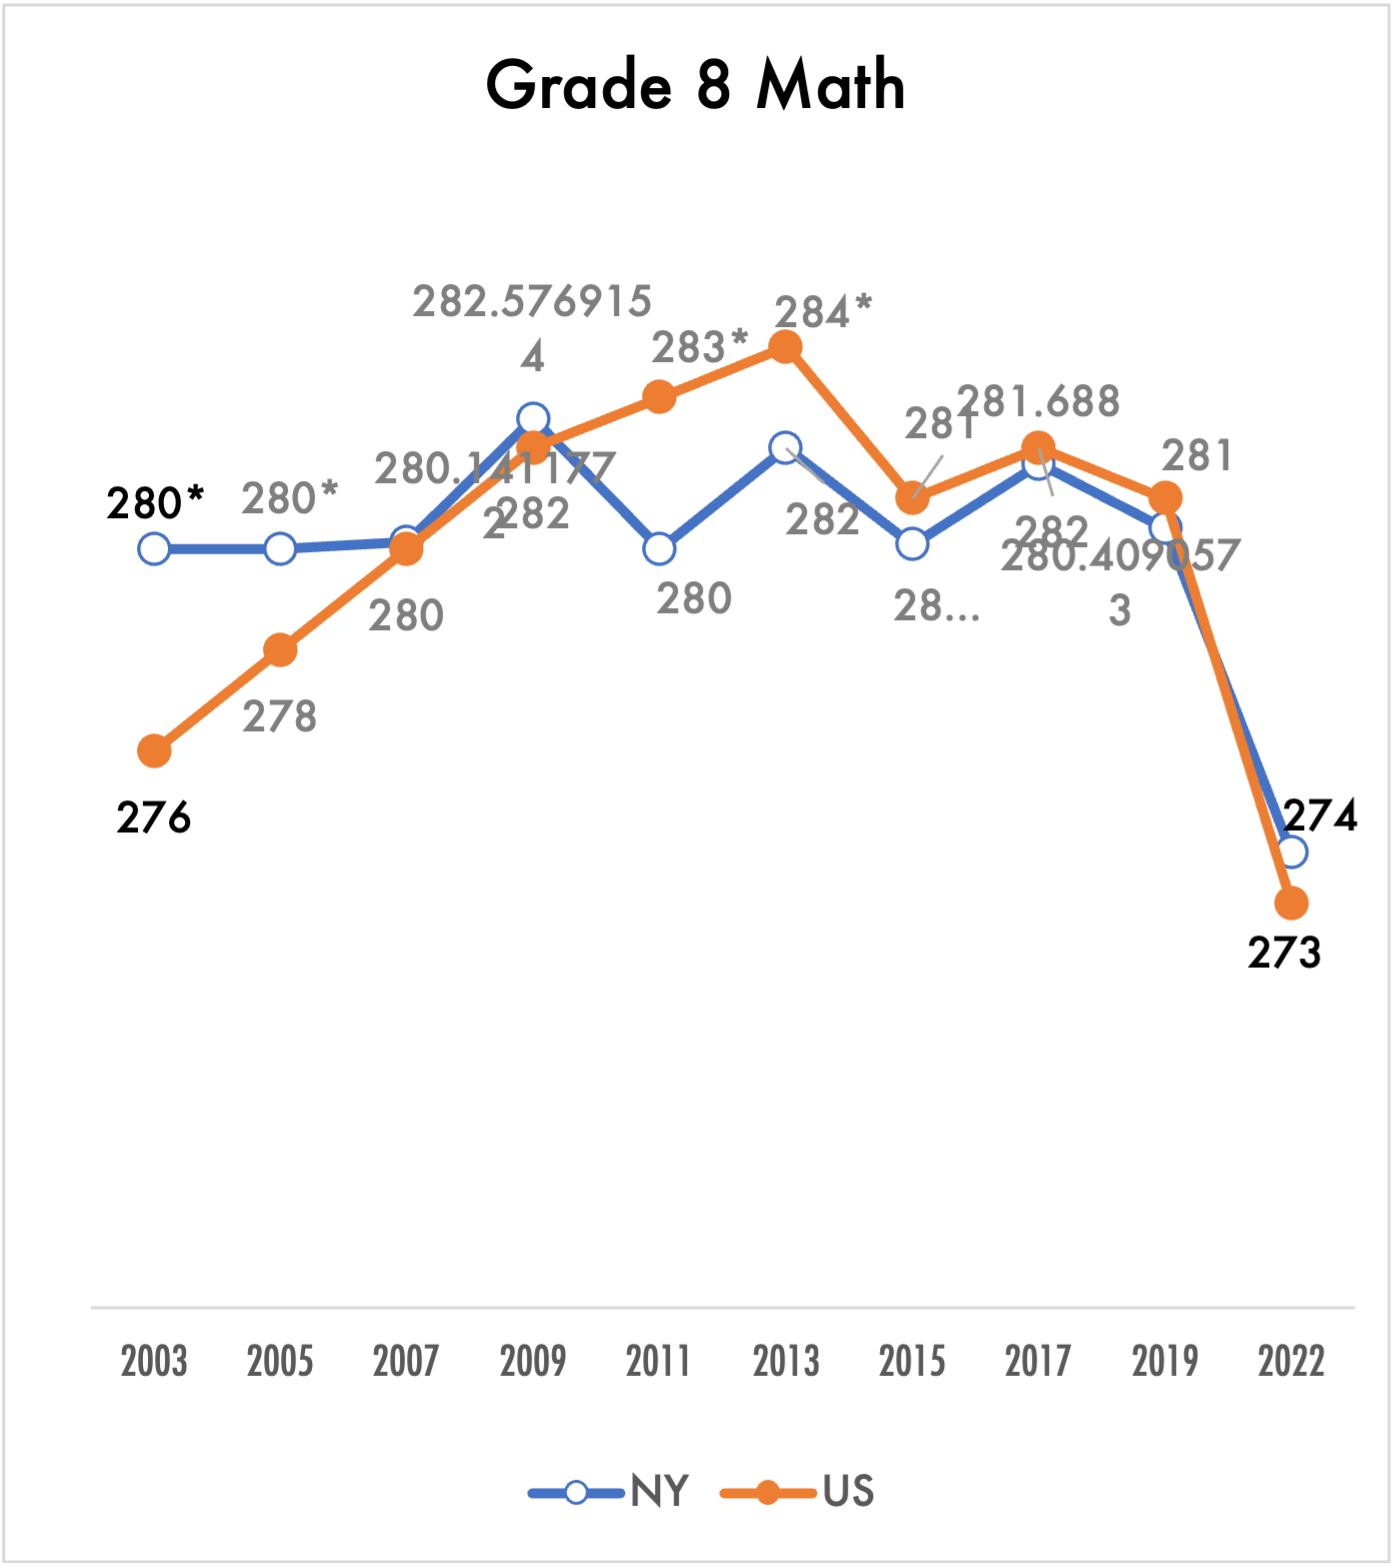
Because the state has made changes to its English Language Arts (ELA) and mathematics tests, effectively moving the goalposts on any attempt to compare trends over time, the most consistent measure of pupil performance over the past 20 years has been scores on the National Assessment of Education Progress (NAEP) tests, which are administered every other year in every state to representative samples of students in grades 4 and 8.6Because NAEP is based on a sample of students, its estimate of a state’s average score contains a margin of error. Fortunately, the NAEP data site allows one to test the statistical significance of the differences in average scores across jurisdictions or years. An observed difference is interpreted as no difference if it is within the standard error of the estimates. As shown in the Exhibit charts below, the NAEP results in a national context don’t come close to aligning with New York’s much higher spending. The NAEP results point to the inescapable conclusion that higher spending on education in New York State has not moved the needle on overall student achievement. But this cannot be blamed on COVID lockdowns; it was as true in 2019 as in 2022.
The story is about the same when NAEP score comparisons are limited to students from lower-income families. In grade 4 reading, the 2022 performance of low-income students in New York was statistically the same as in 2002, no different from the national average. On each test between 2002 and 2013, New York’s poorer students in grade 4 did better than the national average for poor students nationwide—but that has not been true in recent years. The same is true for the grade 8 reading test, with New York’s lower income children scoring above their peers nationally between 2005 and 2011, but then losing that advantage in more recent tests.
In grade 4 mathematics, New York’s low-income students scored below their peers nationally in 2019 and 2022, after scoring above average from 2003 to 2009, and at the national average in all other years. In grade 8 mathematics, New York’s low-income students matched the national average for peers in each of the last three years, after scoring above the average for their peers in 2003-2009 and 2015.
The charter school outcome edge
As shown in Figure 2, however, a bright spot on the achievement landscape in New York has been the performance of charter schools. On the most recent administration of the state’s annual exams in grades 3 through 8 in English Language Arts, students in charter schools outperform those in district-run schools by about 12 percentage points.
Exhibit: Average NAEP Scores, New York vs. National
*denotes statistically significant difference from U.S.
- In grade 4 Reading, New York’s average score in 2019 was statistically unchanged from 2002, indicating no improvement. The national average during the same period was a statistically significant increase of one point. In 2022, after pandemic shutdowns, the state’s scores declined to a statistically significant eight points below the 2002 level, while scores nationally were unchanged from 2002.
- In grade 8 Reading, New York scores improved to significantly above average in 2003, 2005 and 2007, but by 2022 were statistically unchanged from 2002.
- In grade 4 Mathematics, the relative performance of New York pupils has worsened in the post-pandemic period, plunging 10 points from 2019 to 2022, to a level nine points lower than in 2003. By comparison, during the same period, the nation’s scores dropped by four points, to a level statistically unchanged from 2003.
- In grade 8 Mathematics, New York scores essentially equaled the national average, after fluctuating in a narrow range in tests administered between 2003, when it was above average. Both the state and the nation lost ground from 2019 to 2022, ending up at a significantly lower point than in 2003.
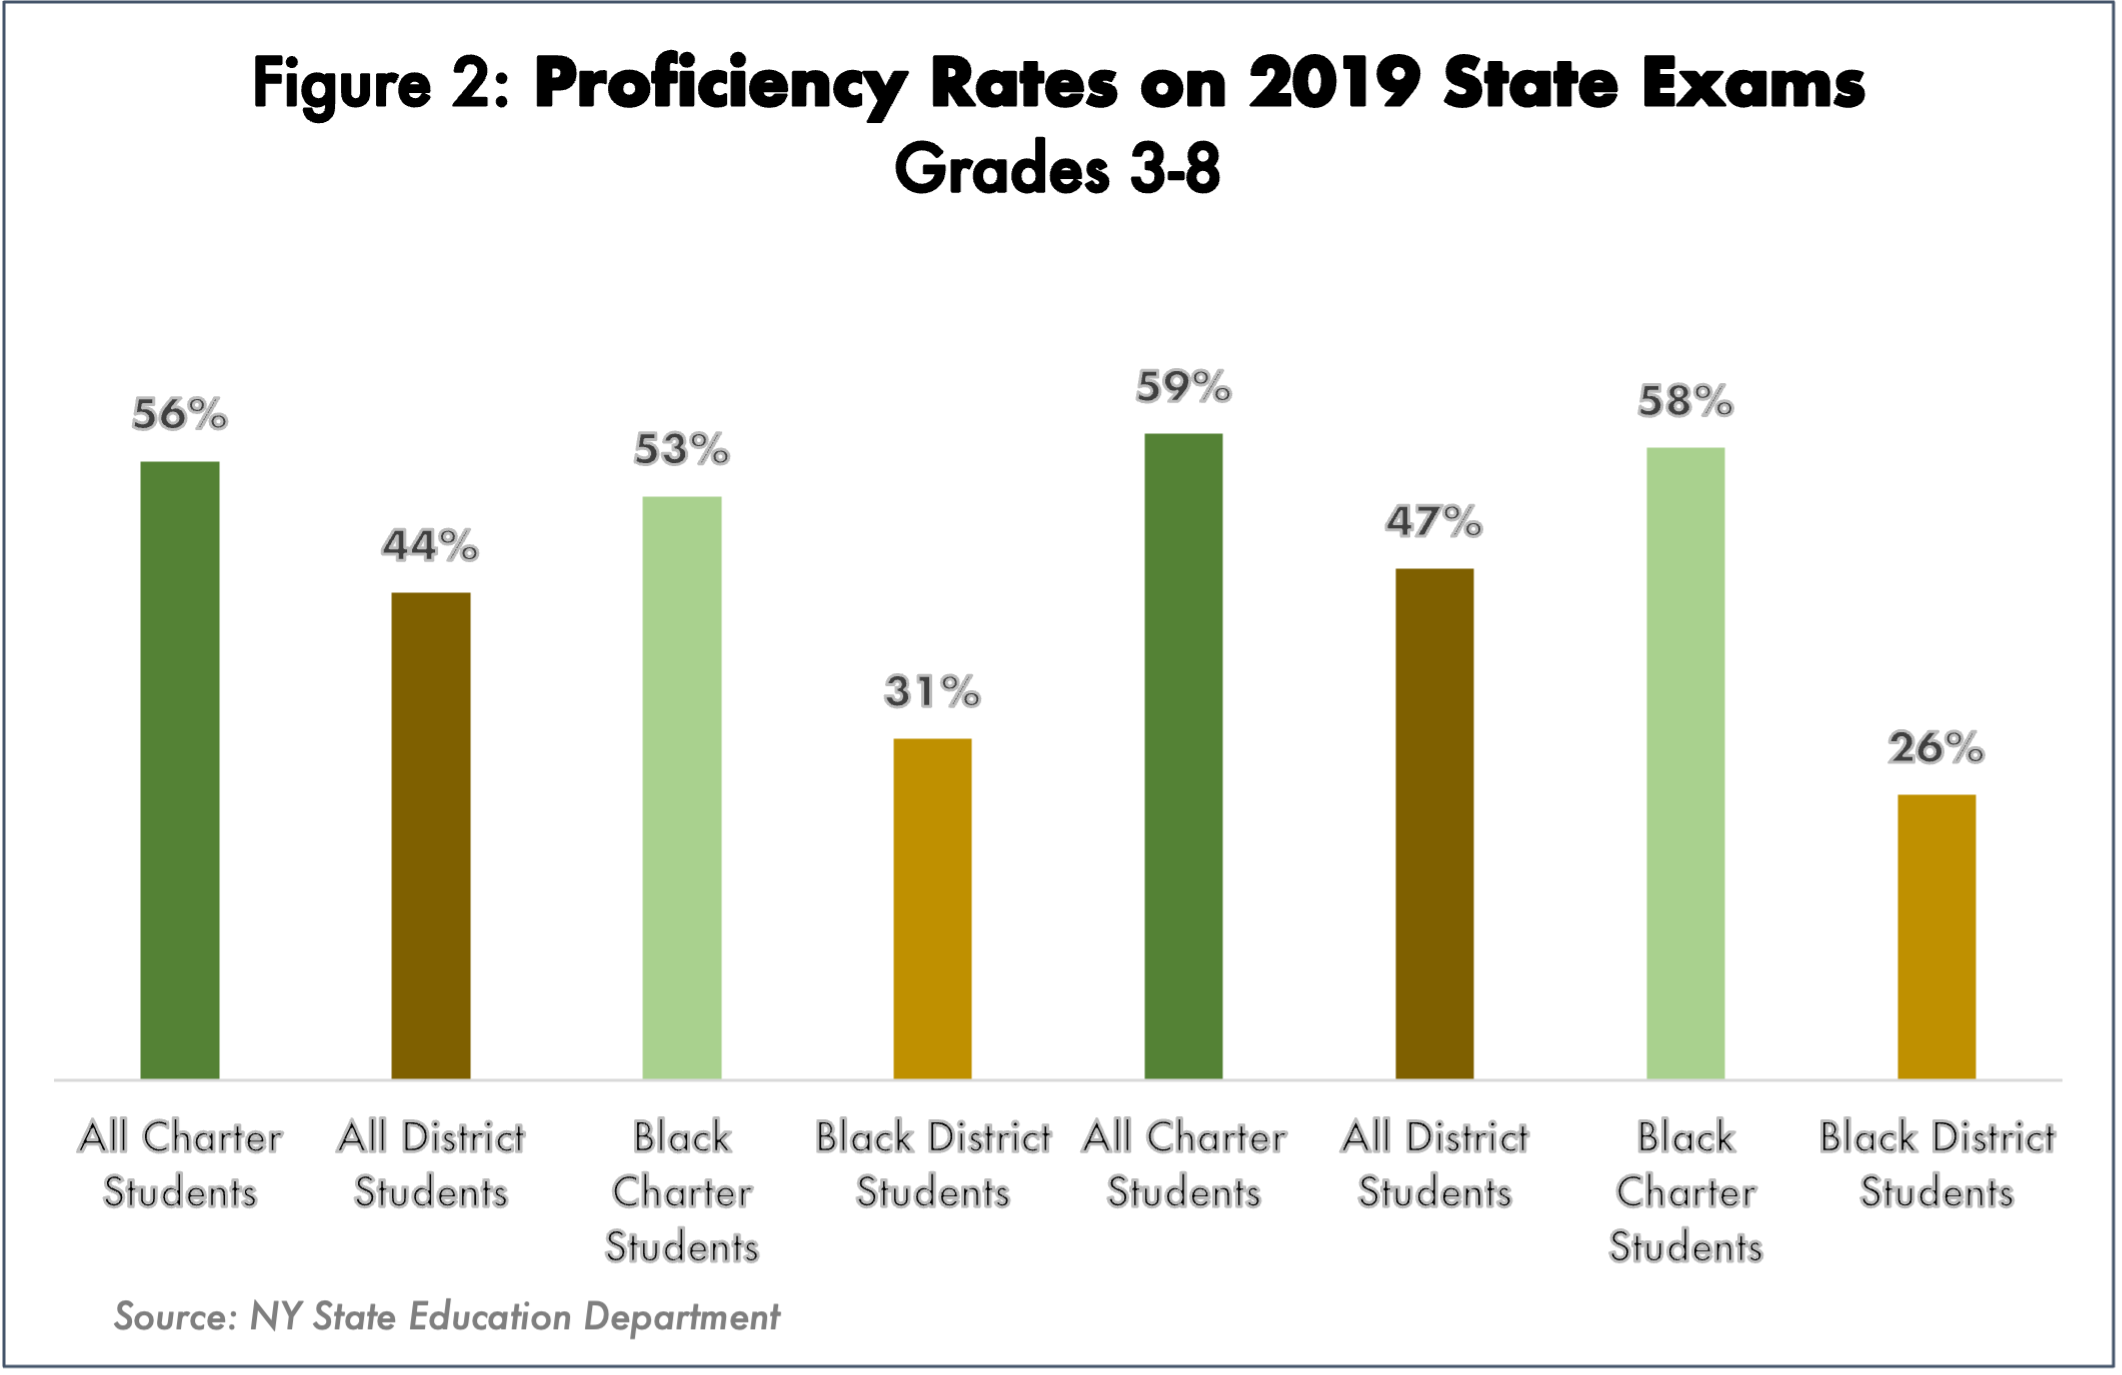
Charter schools manage to stack up well against state average results for all school districts—rich and poor—even though charters are typically found in lower income communities. Considered as if a separate district, New York City’s largest charter school network, Success Academies, would be the highest-scoring district in the state.
As also shown in Figure 2, the charter school advantage is even more dramatic for black students, who outperform the ELA and Mathematics scores of black students in traditional district schools by 21 points and 31 points, respectively. More than 31 percent of black students in charter schools score at the highest level (Level 4) on the mathematics test—higher than the 26 percent share of black students attaining scores in Levels 3 and 4 combined in traditional public schools.
The misguided college-for-all push
In the mid- to late-1990s, the state began phasing in a requirement that all students must take and pass five Regents exams as a minimum requirement for a high school diploma. The exams had been in place since the late 19th century, intended for the subset of students who were deemed able to pursue a college-preparatory track in high school. Other students were placed on a “general” or vocational track and were awarded a local diploma after successfully completing their course of study and passing a single minimum-competency test.
The introduction of the Regents exam graduation requirement for all students paralleled a wave of national school reform efforts that culminated with passage of the federal No Child Left Behind Act of 2001,7P.L. 107-110, 20 U.S.C. § 6319 (2002) which was aimed at promoting the broad standards of greater accountability, higher standards, and expanded choice for parents of children in failing schools.8The NLCB was replaced in 2015 by the federal Every Student Succeeds Act, which reduced assessment mandates on states, but New York did not change its testing program. To comply with that law’s stepped-up assessment mandate as a condition for federal aid to states, New York State in 2006 began administering annual English Language Arts (ELA) and Math tests in Grades 3 through 8.9Prior to 2006, ELA and Math tests had been administered only in 4th and 8th grades.
In 2010, the Board of Regents adopted the multi-state Common Core Standards Initiative, which effectively measured all students against a college-readiness standard. Within a few years, the combination of stepped-up annual testing in elementary grades and controversial Common Core standards had prompted a mini-rebellion among New York parents, who began to exercise their right to withhold their children from taking part in assessments. This “opt-out” movement was particularly strong in suburban and upstate districts, while rates of withdrawal from testing were lower in New York City, other large cities, and in charter schools.10A more detailed description of the school reform efforts and parental pushback is found in “New York’s Parents are Exercising Their School Options”. R. Domanico, Manhattan Institute for Policy Research, June 2022. By 2016, the opt-out rate had reached 22 percent (including 51 percent of white students, according to one study). It declined to 16 percent by 2019, still a fairly strong indicator of parental discontent even before the onset of the COVID-related school closures.
Prior to the pandemic, the Board of Regents announced it would begin considering changes to high school graduation standards. Such a review is clearly necessary: as of 2019, thanks to the increasingly college-focused emphasis of the preceding two decades, only six percent of all students had completed one of five approved multiple pathways in fulfillment of the high school graduation requirement, including career and technical education.
The state’s community college systems, contained within the State University of New York and City University of New York systems, reflect this over-emphasis on academics over preparation for the workforce. Both systems have low graduation rates, and both have few students enrolled in the types of certificate programs being used in other states to quickly prepare students for jobs in the current labor market. As Tamar Jacoby of Opportunity America found in a recent study of community colleges and workforce preparation:
At community colleges nationwide, the mix of programs skews slightly in favor of job-focused instruction. Students preparing for the world of work account for 54 percent of enrollments; those studying traditional academic subjects account for 46 percent. In New York State, the ratio is reversed: 55 percent academic education to 45 percent vocational programs.11“Training Tomorrow’s Workers: Next Steps for New York’s Community Colleges” T. Jacoby, Manhattan Institute for Policy Research”, March 2022.
Given recent policies, there are grounds for concern that the Regents’ review of graduation requirements will result in generally lower standards rather than a mix of more realistic goals for students.
For example, the state Education Department suspended the use of Regents exams at the end of the 2020 and 2021 school years and continued the suspension of some exams in 2022 as well. In September 2022, the department extended a policy allowing students who scored below the traditional passing score of 65 on a Regent’s exam to appeal the grading if they scored a minimum of 50 on that test. This followed years of evidence that the test themselves had been “dumbed down” to maximize the number of passing students. Requiring all students to take examinations that were once only required of college-bound students, and then creating loopholes for students to earn credit for lesser scores, has served only to breed further mistrust in the system.
MOVING FORWARD
The State’s approach to education over recent decades has been to steadily increase spending while nominally raising standards. That approach has failed to deliver on its promises of higher achievement and greater equality of outcomes. Meanwhile, New York’s public school system has been experiencing steep enrollment declines.
Local decisions to keep schools closed to live instruction over the past two years have eroded the trust between families and schools that is so necessary for success. The situation cries out for strong gubernatorial and legislative leadership to rethink educational policy in the state. The guiding principle should be to earn and maintain the trust of families who are their children’s first educators. Mandates from Albany, and the passing on of mandates from Washington must be curbed in favor of local, democratic governance of school districts and expanded choice for parents outside the school district system.
Families differ in what they expect of schooling. Some fully expect their children to attend and succeed in college. Others see their child’s future in the trades or other forms of work. Some believe that the primary goal of education should be to prepare children for economic success in life. Others believe that the purpose of schooling is to mold adults of strong moral character and emotional well-being, particularly when it conforms to their own beliefs, religious or otherwise.
State officials should not respond to all of these legitimate beliefs about the purpose of education with a top-down, one-size fits all approach. Rather, they should embrace the concept of educational pluralism, reflecting the pluralistic nature of the state’s population. There are five broad areas in which the governor, in particular, can lead a change in approach to education:
- Expand school choice. The cap on new charter schools in New York City should be abolished. In addition, the state should respect parental choices and acknowledge the value that many parents hold for religious education. In implementing the Board of Regents’ latest regulations on “substantial equivalency” in private and religious schools, local school districts should tread lightly and only intervene in the extreme cases of educational neglect. In addition to reviving the Educational Investment Incentives Credit, the state should enact a program diverting a portion of local school aid to Education Savings Accounts for parents and guardians who choose to withdraw their children from state-funded public or charter schools in favor of private schools. Funds in the savings account could be used to pay private school tuition or supplementary education services such as private tutoring or online learning.12For a fuller description of ESAs, see: “Educational Savings Accounts: How ESAs can promote Educational Freedom for New York’s Families and Improve State and Local Finances” M. Lueken, Manhattan Institute for Policy Research, October 2021.
Rein in spending. State aid increases have served mainly to subsidize generous teacher salaries and costly fringe benefits, as reflected by long-term spending trends. Going forward, however, unrestricted Foundation Aid to local districts should be strictly linked to enrollment, with no mandatory minimum increases for districts with declining pupil counts. A portion of funding should instead support innovations such as Educational Savings Accounts and incentive credits, which could save the state and local school districts between $158 and $301 million per year.13See Lueken.
Align graduation and proficiency standards with real-world needs and expectations. The Regents should back away from its exclusive college-readiness goal and re-establish high school curriculum and assessment tracks oriented toward preparation for entry to the workforce, creative arts, or any number of other valid outcomes of high school.
- Expand community college trade and workforce preparation programs. Too few students entering the state’s community college emerge with a two-year degree. More than half do not even return to school for their second year. While the ability to begin work towards a bachelor’s degree in community college should be maintained, that approach works for too few. SUNY and CUNY community colleges need to embrace a new approach and ramp-up short-term certificate programs aligned with industry standards in various fields and create more associate degree programs also aligned to industry standards. These efforts must be planned and developed with the full participation of industry and labor leaders.
- Reform educational governance to build accountability. Nineteen of the 20 executive branch departments of New York State government are run by gubernatorial appointees. The exception is the State Education Department, whose commissioner and staff are answerable solely to the Board of Regents, constitutionally designated as New York’s pre-eminent educational policy-making and professional credentialing body. Under current law, the board consists of 17 members serving five-year terms—one representing each of the state’s judicial districts, and four selected an at-large basis—all appointed by concurrent resolution of the Legislature. While the governor plays a lead role in shaping the finances of the education system through the Executive Budget, legislative control of Regents appointments unduly limits the education policy input of New York’s elected chief executive. This can be remedied by amending Education Law to require the Legislature to select all four at-large Regents solely from lists of nominees advanced by the governor, and to require that the Regents elect their chancellor from the at-large group.14This could be accomplished within the next gubernatorial term, since the current terms of all four at-large Board of Regents members, including Chancellor Lester Young, expire by 2025.
Governance reform is needed at the local level as well. In districts outside the state’s five largest cities, the odd timing of school board elections and budget votes limits voter turn-out and makes it easier for organized local interest groups, particularly teachers’ unions, to dominate the process. Shifting these votes to November (while keeping board elections nonpartisan) would serve to increase turnout and broaden the base of local groups involved in the process. Further, the State Education Department and Board of Regents should promulgate guidance on the true purpose of school boards, which is to mediate discussion between the larger community and the local school system’s leadership on policy matters.
APPENDIX
The Structure of Schooling in New York State
New York’s education sector is large and diverse. In the most recent year, 2021-22, over 2.8 million students attended one of 6,520 district, charter, and private religious schools in the state.
Outside of New York City, the average school district includes 6.4 schools, with average enrollment of 517 students per school and total enrollment of 3,320 students. In all but the largest cities, public school districts cover parts of multiple municipalities and have a separate tax base and tax-collection calendar. These mostly suburban and urban districts are very local in nature, each with their own elected school board and budget levies subject to local votes.
The cities of Buffalo, Rochester, Syracuse, and Yonkers are governed by separate school boards but funded out of municipal budgets, without separate budget votes or tax levies. New York City is the outlier, with a single district and a 15-member school board, known as the Panel for Education Quality, whose majority is controlled by eight mayoral appointees. Its budget is set through negotiations between the Mayor and City Council.
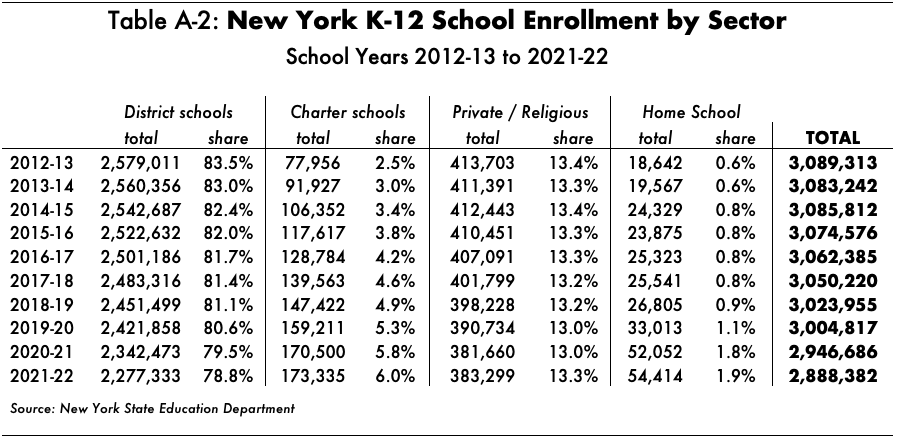
Between 2012-13 and 2021-22, New York State’s school enrollment across all sectors decreased by 200,931 students, or 6.5 percent, as detailed in Table 4 below. A loss of 301,678 students in district schools (-11.7 percent) was partially offset by growth in the charter school sector, which gained 95,379 students in those years—a 10-year growth rate of 122 percent. Private and religious schools lost 30,404 students, a drop of 7.3 percent. The smallest sector—home schooling—was also the fastest growing. The number of home-schooled children nearly tripled, from 18,642 in 2012-13 to 54,414 by 2021-2122, with most of that increase starting after the pandemic.
These enrollment trends have changed the mix of schooling in the state, as traditional district-run public schools now enroll 78.8 percent of all K-12 students, down from 83.5 percent ten years ago. Charter school enrollment has increased rapidly, to six percent of all students. Charter growth has been much more rapid in New York City than in the rest of the state; 11.8 percent of the city’s students now attend charter schools, though the creation of new charter schools in the city is currently halted under a state-imposed cap on the number of such schools in the city.
State-wide enrollment in private and religious schools has remained constant at 13.3 percent of all students, but the percentage of home-schooled students has more than doubled since 2018-19, to 1.9 percent of all students. New York City has a higher percentage of students in private and religious schools, 18.7 percent, and 47 percent of those students are in the growing Jewish school sector.
Ray Domanico is a senior fellow and director of education policy at the Manhattan Institute.